CASE STUDY · EY
Data Fusion & KMS
Designing the interface of EY's AI-powered data platform for financial institutions, and the new apps being built on top of it.
- My role
- Lead UX/UI Designer
- Company
- EY
- Screens designed
- 100+
- Tools
- Figma, Miro, Motif (EY design system)
- Methodology
- Scrum, Azure DevOps
- 150+clients in production
- 9,000+data sources
- 6,000+business rules
- Up to 50%faster pipeline development
Public figures from EY's official presentation of the platform.
01 · THE PLATFORM
See it in action
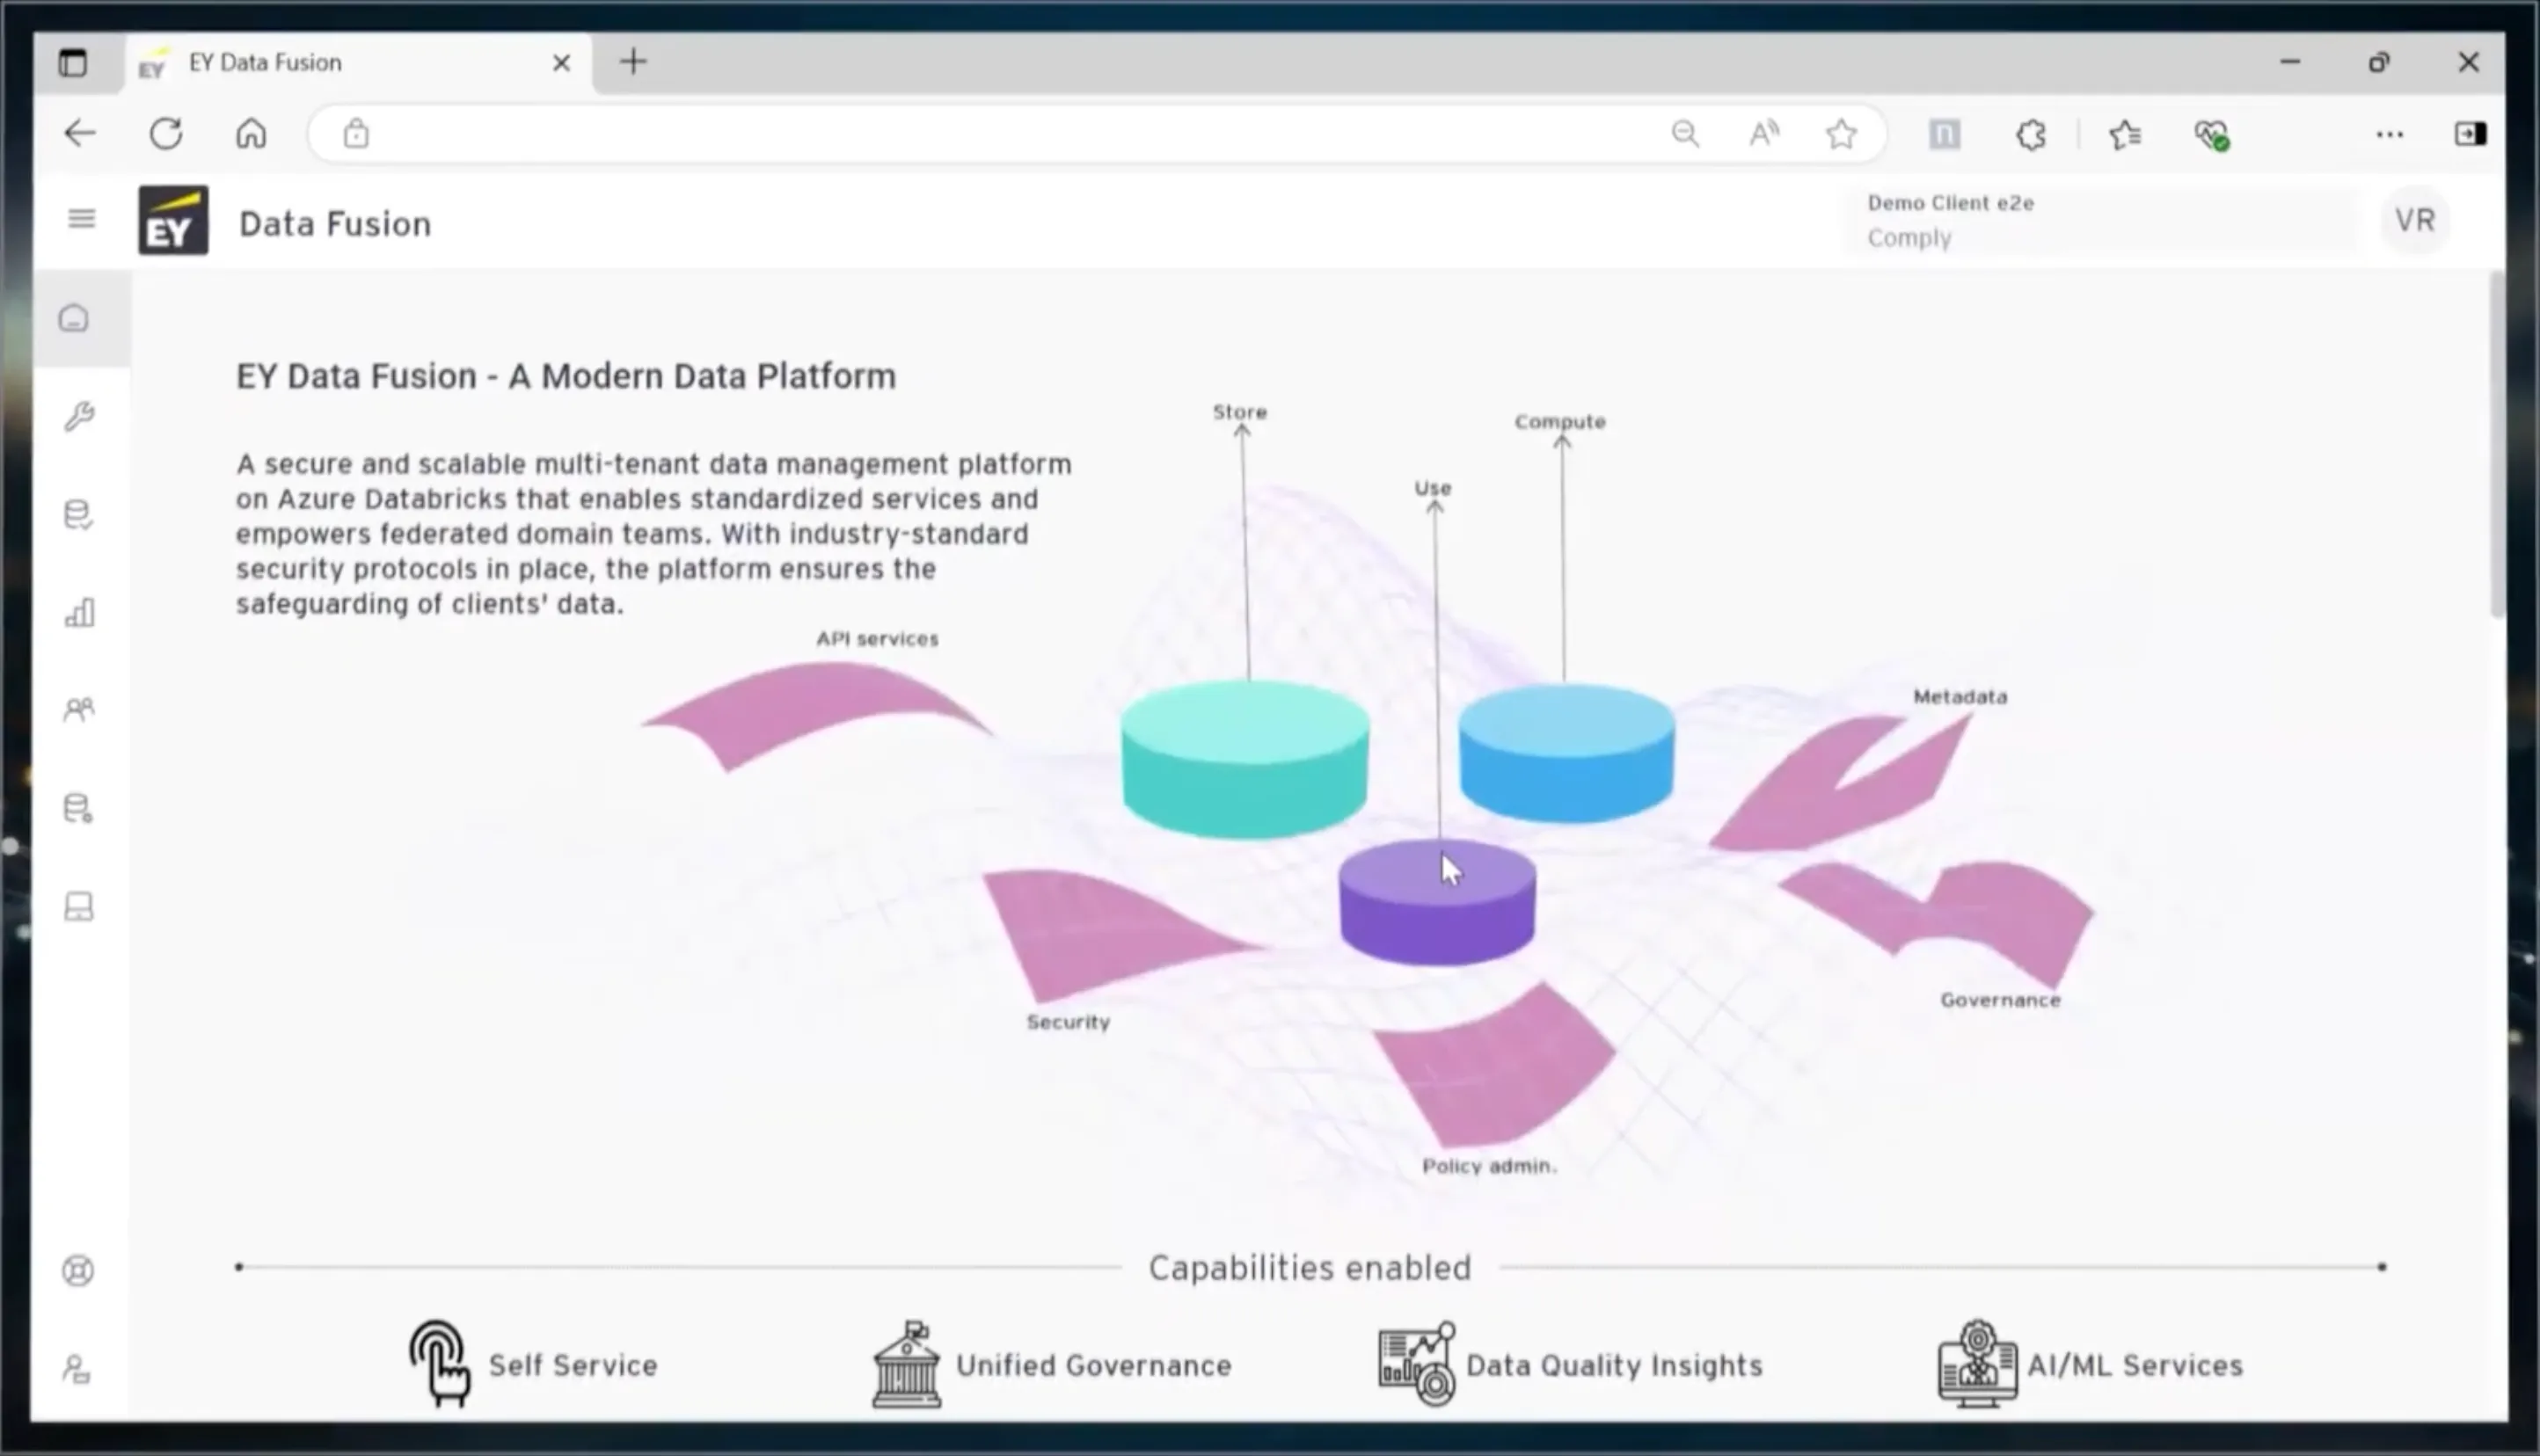
This is EY's official presentation of Data Fusion. It walks through the main modules of the platform: data preparation, governance, data quality, discovery and operations.
02 · CONTEXT
What is Data Fusion?
In plain words
Banks and financial institutions receive data from thousands of places: internal systems, files, partners. Before that data can be trusted for reports, decisions or AI, someone has to bring it in, clean it, check it against business rules and organize it. Data Fusion is the platform where all of that happens.
It is a cloud-native, AI-powered, multi-tenant platform built on Databricks. One platform serves many clients, each in its own isolated space, and a low-code / no-code interface lets business and technical teams work with data without writing code.
What the platform does
- 01
Data Preparation
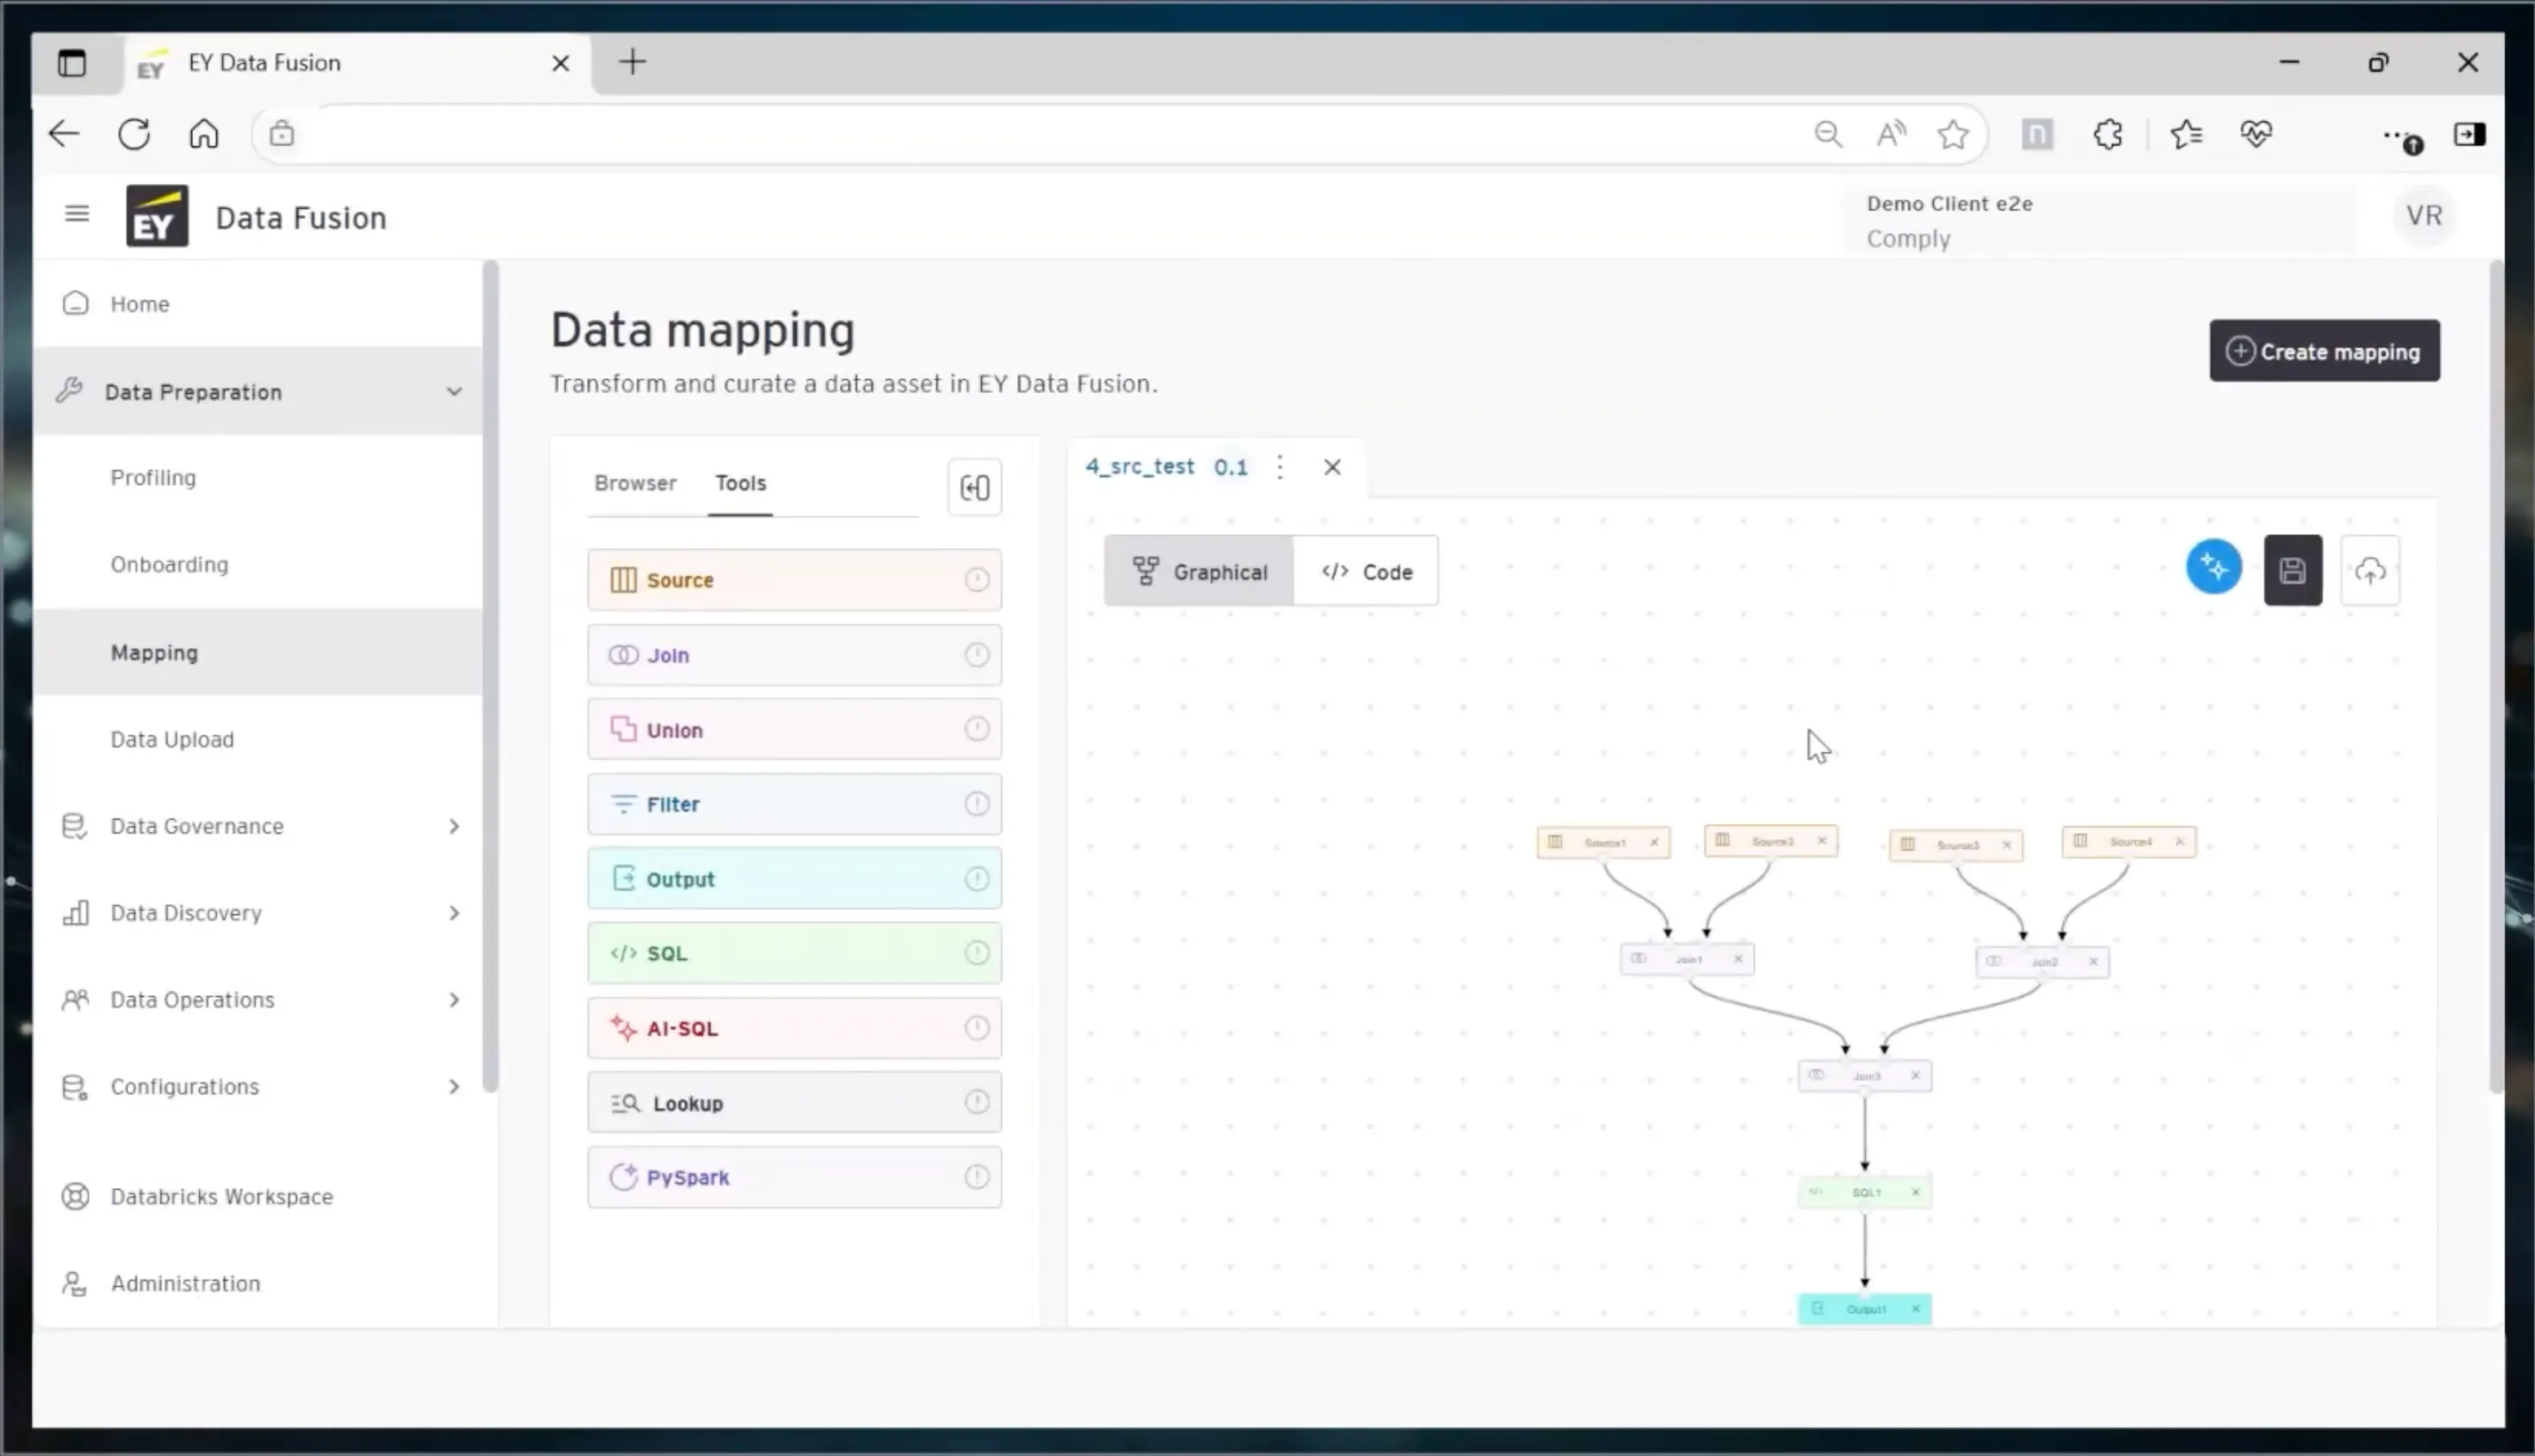
Upload files, profile them to find patterns and anomalies, onboard new data sources and map raw data into curated datasets.
- 02
Data Governance
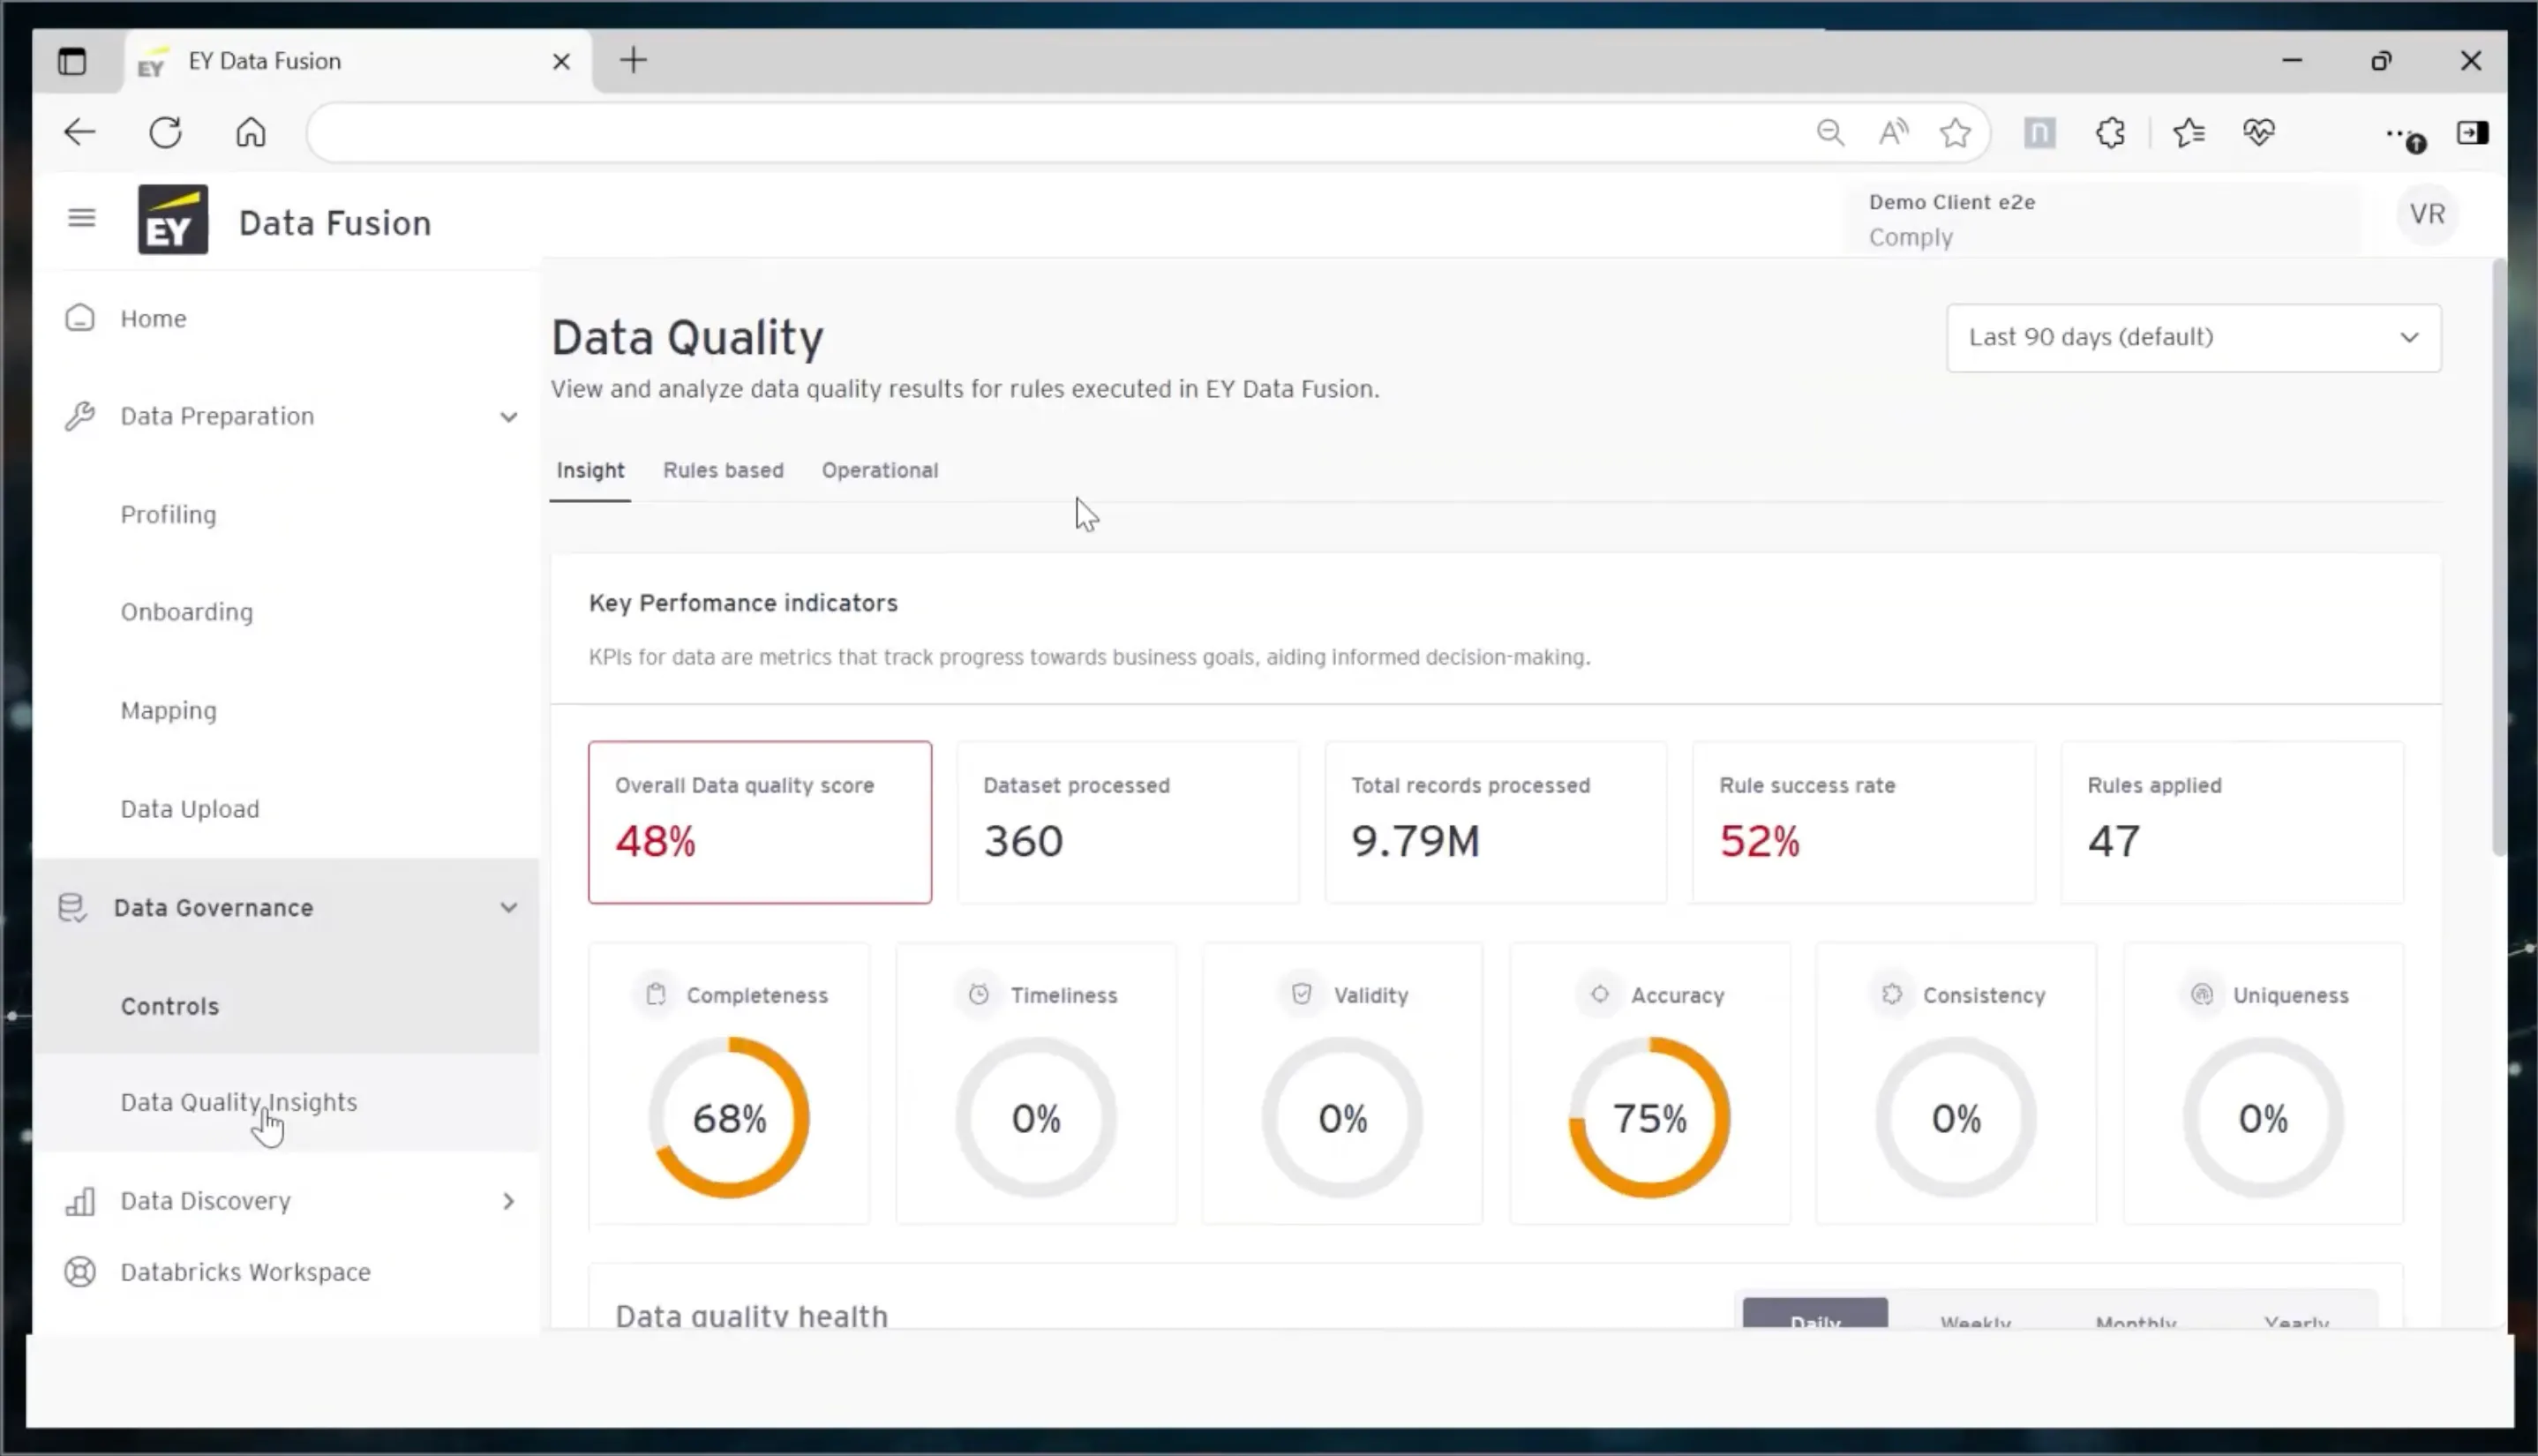
Define and enforce each client's rules, and follow the results in Data Quality Insights.
- 03
Data Discovery
Explore raw and curated data with SQL queries in the Data Explorer.
- 04
Data Operations
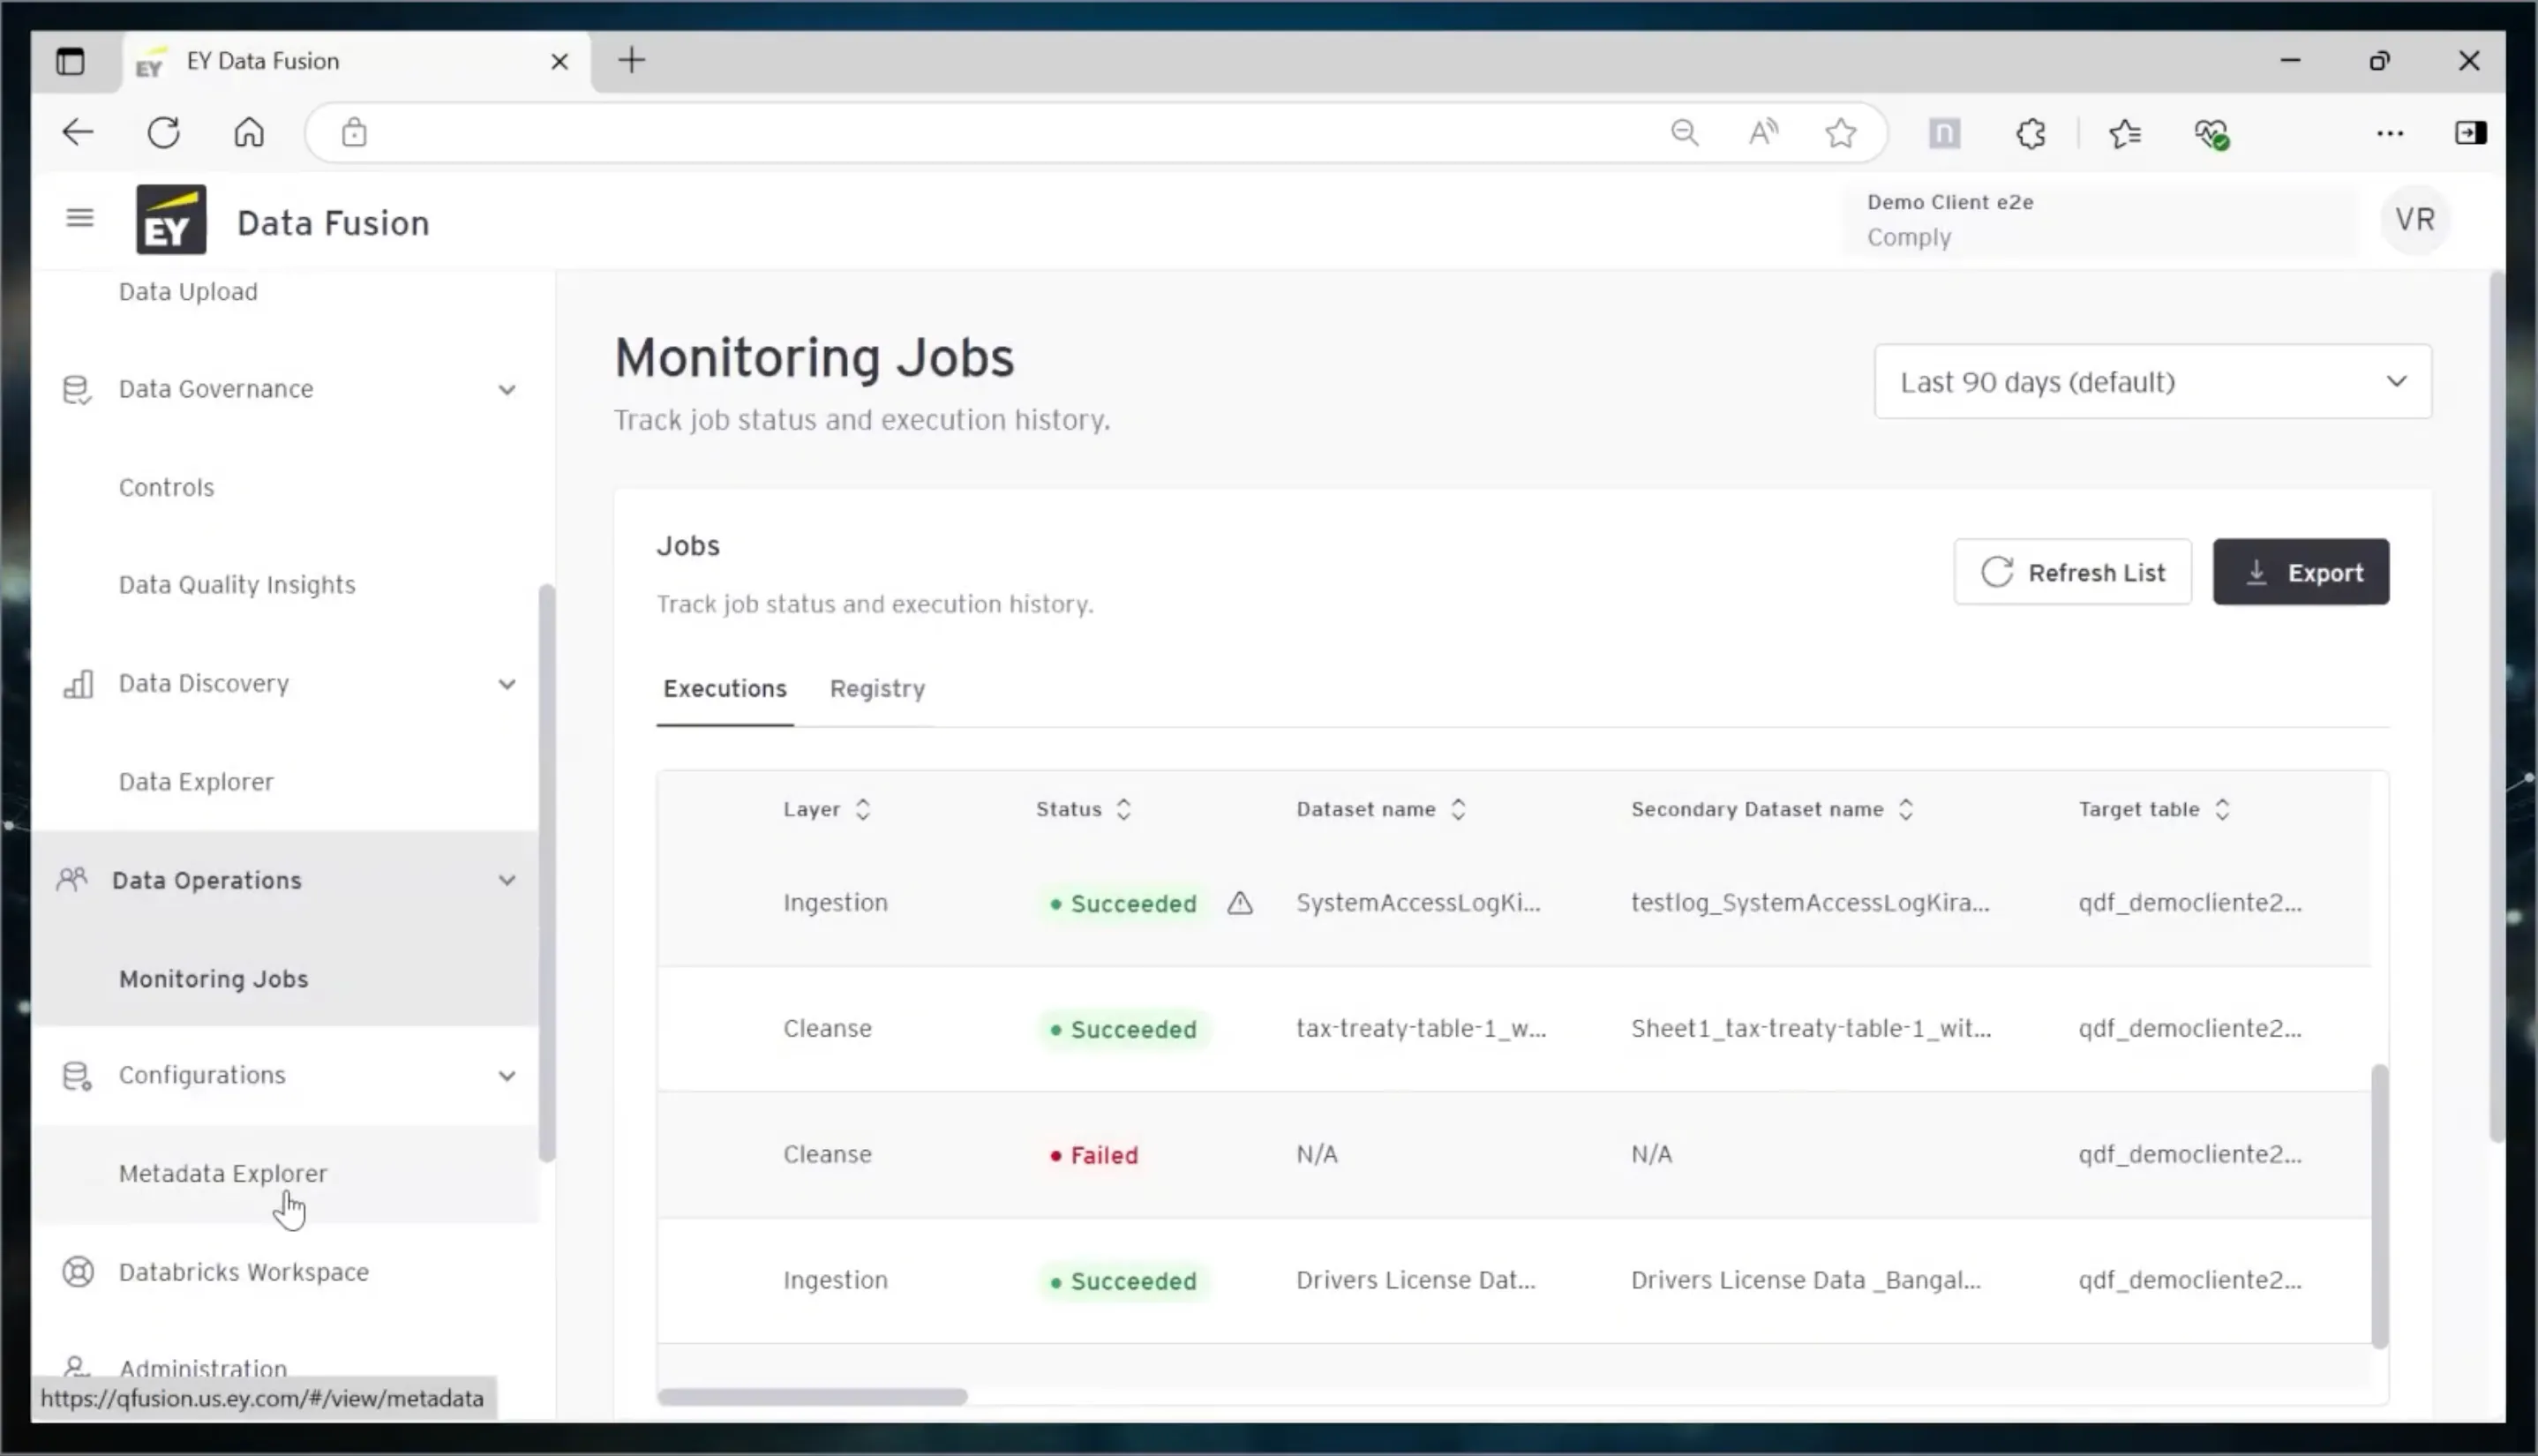
Track the status and execution history of every data job.
- 05
Configurations
Query the platform's metadata through the Metadata Explorer.
- 06
App Gallery
AI and machine learning apps that extend the platform, from anomaly detection to document intelligence.
AI built into the workflow
- AI
Data Mapping Agent
Creates or refines a data mapping from a prompt written in natural language.
- AI
Rule Agent
Writes the SQL of a data quality rule automatically, and the user can still edit it.
- AI
Sensitive data detection
Finds personal and sensitive information inside the data.
- AI
AI-driven data quality
Spots anomalies and outliers before they turn into problems.
Screens from the video
03 · MY ROLE
Lead designer of the platform
I make the design decisions for Data Fusion and I execute them: from understanding a requirement with engineering, to the flow, to the final high-fidelity screens that go into development. I also design the variations of the platform, like KMS and the micro frontend apps that are joining it.
- 01
Design decisions
I define how each feature works and looks, and I defend those decisions with stakeholders and tech leads.
- 02
End-to-end execution
Flows, wireframes, prototypes and high-fidelity screens, built with Motif, EY's design system.
- 03
Translating complexity
I turn data engineering requirements into interfaces that business users can understand and use.
- 04
Quality after handoff
I review what was built against the design and flag gaps before they reach production.
Who I work with every day
- Managing DirectorProduct ownership and vision
- 3 Tech Leads1 focused on AI, 2 on product
- Data EngineersPipelines, rules and data logic
- Product ManagerRoadmap and priorities
- Product OwnerRequirements and backlog
- Scrum MasterSprints and ceremonies
- DevelopersFrontend, backend and AI
One platform, several products
Data Fusion
The core platform: ingestion, governance, data quality, discovery and operations.
KMS Fusion
A new app built on top of Data Fusion that turns unstructured documents into a searchable knowledge library.
Micro frontend apps
A navigation model that lets independent apps live inside Data Fusion as one single experience.
04 · THE CHALLENGE
Learning the language of data
My biggest challenge was not the interface, it was the domain. Data engineering is full of concepts that are invisible to most people, and I could not design good screens for something I did not understand.
How I closed the gap
- 01
Asked a lot of questions
Daily contact with data engineers and tech leads. I kept asking until I could explain each concept in my own words.
- 02
Desk research
I studied ETL, data quality, governance, ontologies and the difference between structured and unstructured data.
- 03
Wrote it down
Guide documents and flowcharts explaining the key concepts, validated with stakeholders. They became a reference for the team too.
- 04
Designed for the non-expert
Having been the beginner, I knew where the language was too technical, and pushed for clearer labels and guided flows.
A few of the words I had to learn
- ETL
- Extract, Transform, Load. Taking data from a source, reshaping it and storing it where it is useful.
- Data profiling
- Scanning a dataset to understand it: its structure, value distribution, empty fields and outliers.
- Data mapping
- Defining how the fields of a raw source become fields of a curated, standard model.
- Data quality rule
- A check the data must pass, like "every account has an owner". Usually written in SQL.
- PII / PCI
- Personal and payment card information. Sensitive data that must be found and protected.
- Tenant
- One client's isolated space inside a platform shared by many clients.
- Ontology
- A map of concepts and how they relate to each other, like "Lasagna contains Cheese".
- Unstructured data
- Information that does not live in tables, like PDFs, forms and reports.
The rest of this case study is locked
Enter the password to see the rest.
Wrong password. Please try again.